Screenshots
Here are several screenshots of reZonator of version 1 with short descriptions of what you can see on them. Screenshots for the current version 2 are here. Click on the picture to open it in the full size.
Schema window and layout
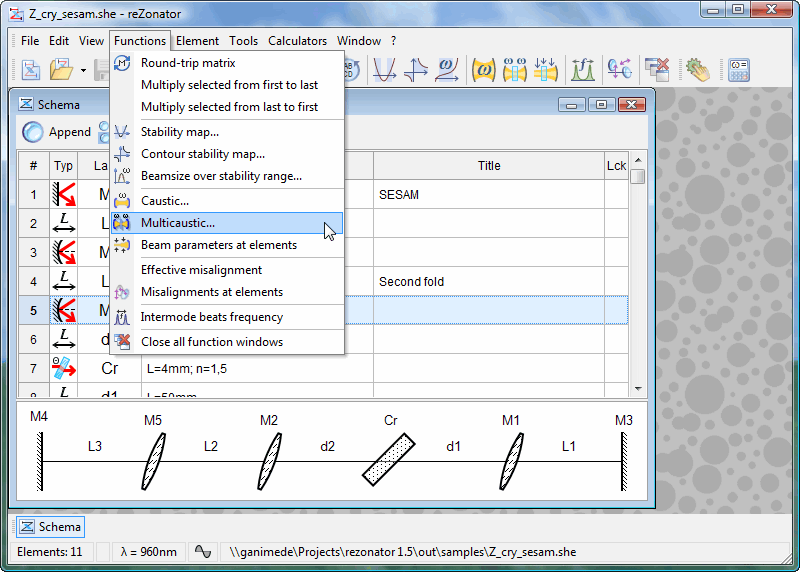
Window “Schema” contains the table of optical elements.
It also shows automatically generated layout of the optical system at the bottom.
Various analysis tools available via the menu “Functions.”
Element catalog
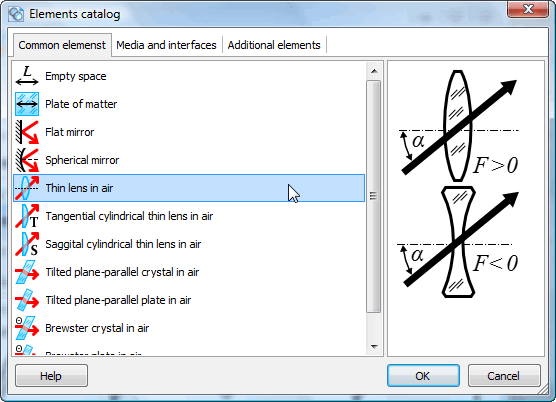
Element catalog used to add elements to the optical system.
Element list, at the left, enumerates elements' titles and their icons.
Element outline, at the right, gives a notion about all the element parameters.
Caustic plots
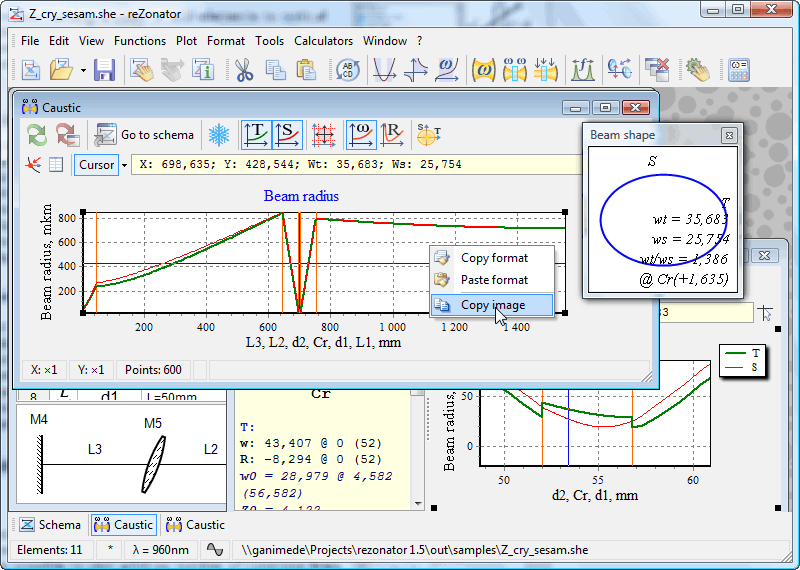
Caustic plots are results of functions “Caustic” and “Multicaustic.”
Line “Cursor” at the top of the plot shows the function values at a specified point.
Panel “Characteristic points,” the yellow panel at the left, displays some values notable for the given function.
Window “Beam shape” visually demonstrates astigmatism of the system.
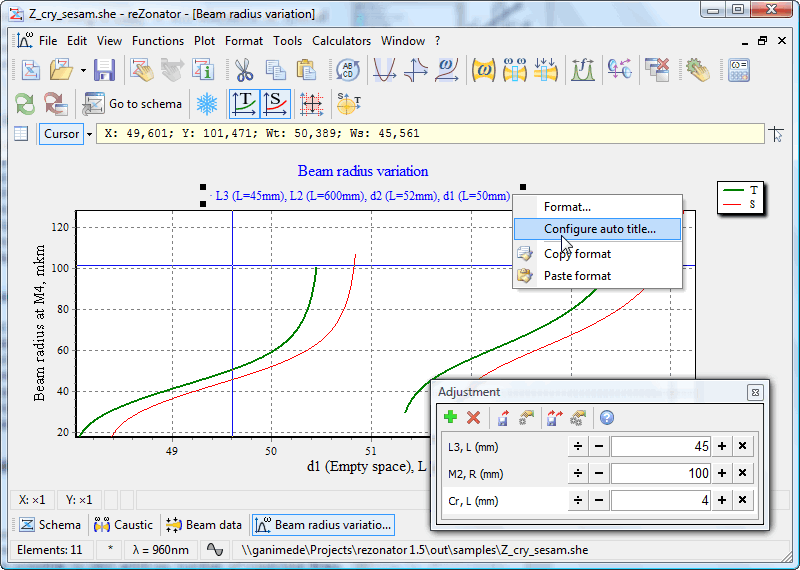
Variation of beam size, adjustment, and auto title
You can plot beam size variation at some element while the stability of the system changes.
The “Adjustment” tool allows for varying parameters of elements in a given manner. Change in parameter values immediately reflects on the results of the functions - all graphs automatically recalculate.
The “Auto title” tool shows specified elements parameters in graph title in “live” mode.
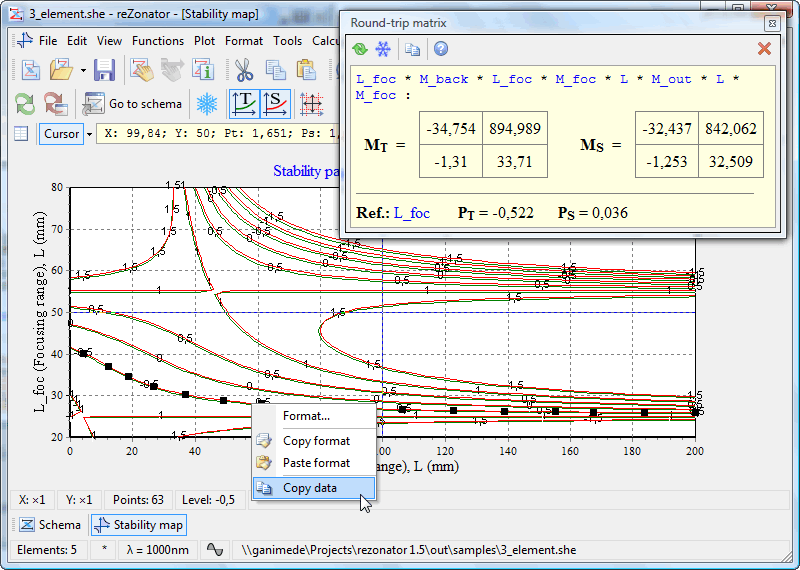
2D stability map and Round-trip matrix function
The contour stability map displays system stability versus the values of two parameters. It is possible to plot an arbitrary number of contour lines. The “Round-trip Matrix” function shows how the beam traverses the system, and how matrices of elements are multiplied.
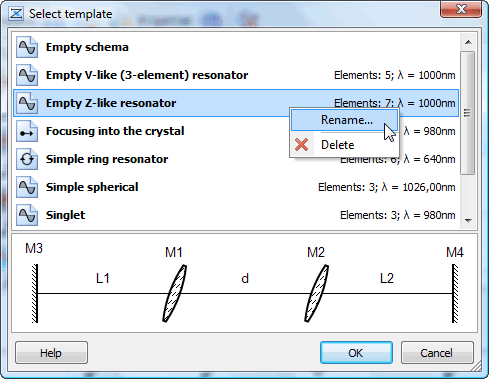
Schema templates
You can save your schemas as templates to quickly create new schemas with predefined element sets and parameter values.