Using of 2D Stability Map function
In this tutorial, we continue working on the schema created during the previous tutorial.
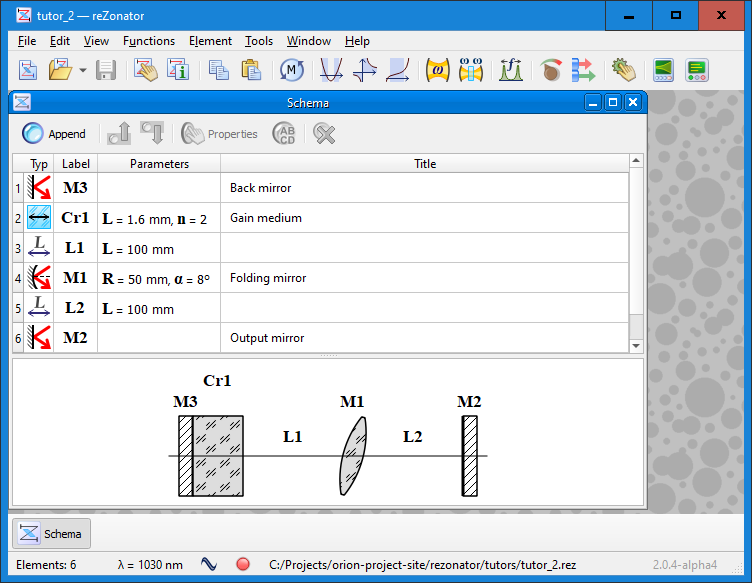
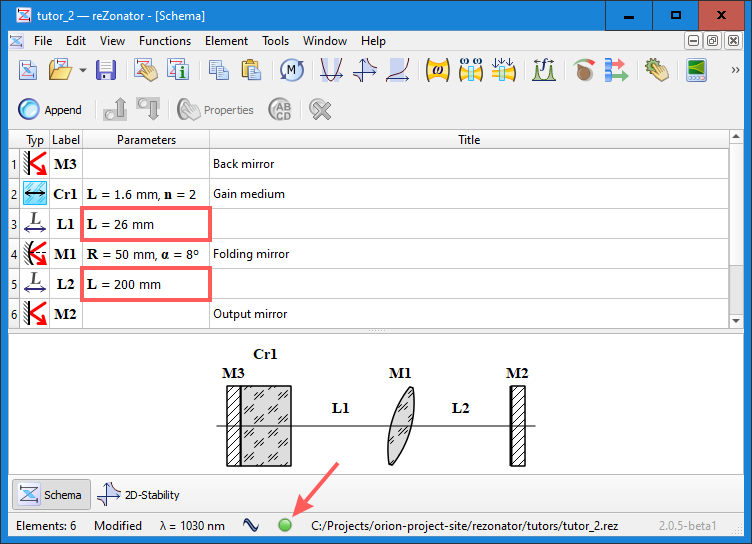
Now we have a schema populated with elements and their parameters set to some values. While some of the elements have known parameters because they are maybe what you've got in the lab, parameters of other elements are subject to calculation. They have to be chosen to make schema working.
For this V-shaped cavity, L1 and L2 elements are obvious candidates for such estimation, so let's use the "2D Stability Map" function to find out how they affect system stability. Currently, there is a red lamp icon displayed in the status bar meaning the system is not stable and can't provide laser operation.
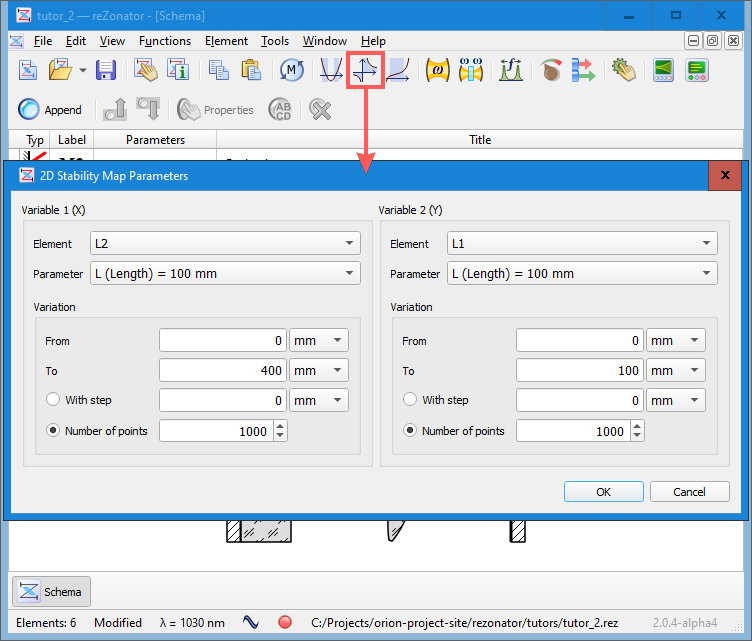
Invoke the "2D Stability Map" function by clicking a button on the toolbar of view the menu "Function -> 2D Stability Map...". A dialog opened when you can select what parameters of what elements to change and the precision of plotting.
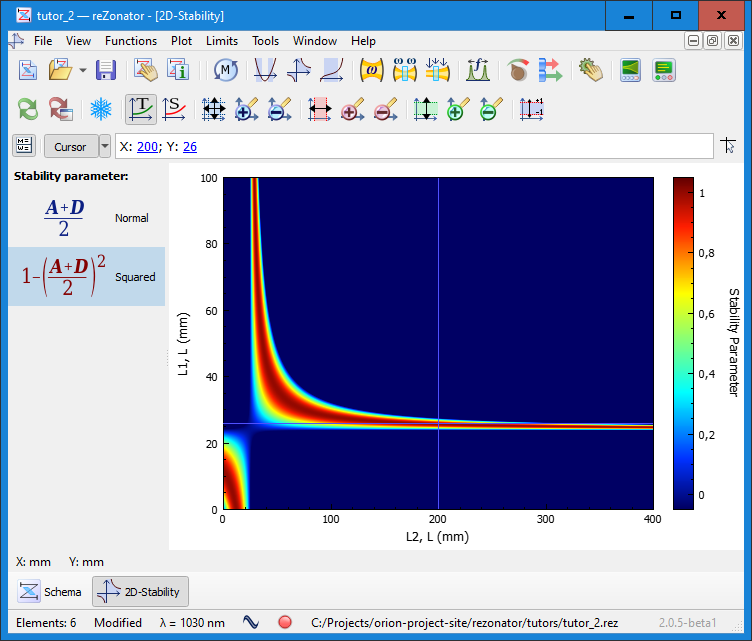
The "2D Stability Map" function plots a "heatmap" - values of the stability parameter expressed in different colors. You have to choose values for variable parameters looking at the value color. What colors should be checked depends on a method of stability parameter calculation. Hit the small button near the "Cursor" button to open the left panel to switch between calculation modes. When the mode is "Squared," you should select a position between dark-blue colors - they are 0 and above values of the stability parameter.
When the stability parameter is calculated as "Normal," you should select a position between brown and dark-blue colors - they are from -1 to 1 values of the stability parameter.
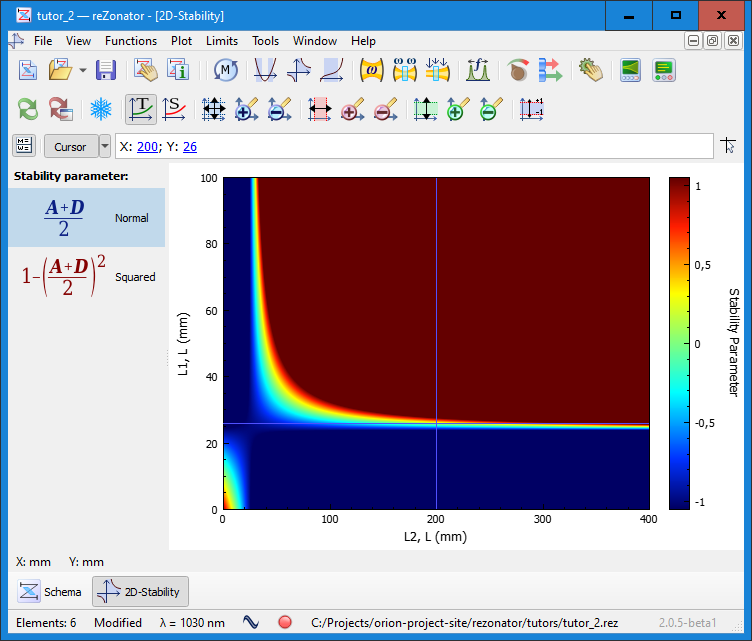
Look at the right color scale to check what colors you should consider as "stable" and "unstable"; you can change the color scale by clicking the color axis and scrolling the mouse wheel.
Version 1
In version 1, function "Countrour Stability Map" plays the same role. However, instead of the "heatmap" it calculates isolines for specific values of the stability parameter.
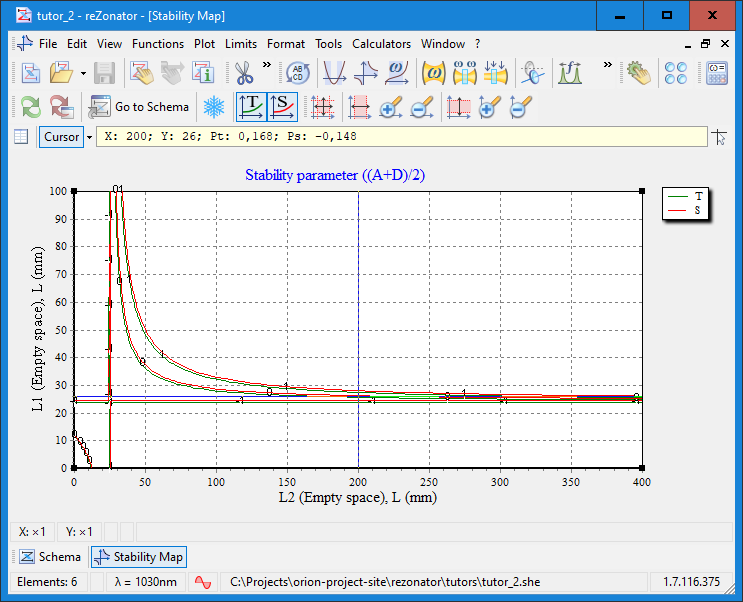
On the figures above, you can see the cursor lines placed at the point X=(L2)=20mm and Y=(L1)=26mm, and this point is somewhere between "unstable" colors. Assigning these values to lengths of elements L2 and L1 turns the stability icon in the status bar into green, meaning the schema is stable and probably can support laser operation.
Download schema file for version 1, for version 2.